The Golden Ratio in Faces: Myth vs. Research
The 1.618 myth is everywhere — here's what the data actually shows
The golden ratio claim
You've probably seen the claim: the most beautiful faces conform to the golden ratio (1.618:1). Overlay a phi mask on Audrey Hepburn or Angelina Jolie, and the lines seem to align perfectly. The idea is ancient — it's been attributed to Leonardo da Vinci and the Greeks — and it's been repeated so often that it feels like established science.
It isn't. The golden ratio as a universal standard for facial beauty is largely a myth, and the actual research tells a more interesting and more useful story.
What Pallett, Link & Lee actually found
In 2010, Pamela Pallett, Stephen Link, and Kang Lee published a landmark study in Vision Research titled "New 'golden' ratios for facial beauty." Their approach was methodical: they systematically varied the vertical and horizontal spacing of facial features in photographs and had participants rate attractiveness.
Their findings were striking. The most attractive faces had specific proportional relationships — but they were not the golden ratio of 1.618. Instead, they found two "new golden ratios" for facial beauty:
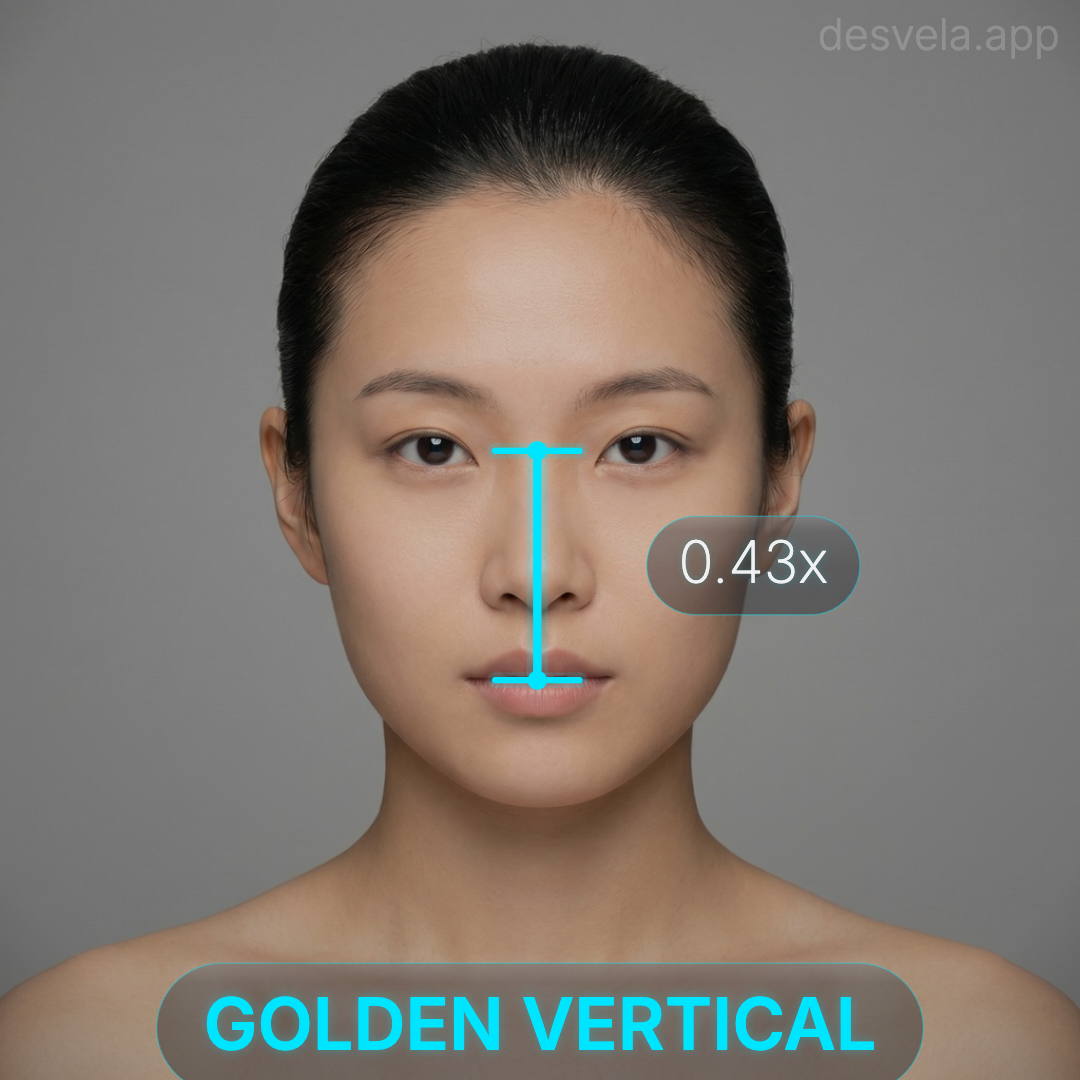
Vertical ratio: The distance from the eyes to the mouth should be approximately 36% of total face length (hairline to chin). The classic golden ratio would predict 38.2%.
Horizontal ratio: The distance between the eyes should be approximately 46% of total face width (ear to ear). The golden ratio would predict 38.2%.
These are not arbitrary numbers. They happen to match the average proportions of the human population — which led Pallett et al. to a compelling conclusion: we find faces most attractive when they are closest to the population average. This is the averageness hypothesis, and it's supported by a large body of cross-cultural research.
Why the phi mask is misleading
The phi mask overlays are compelling visual demonstrations, but they work through a combination of confirmation bias and flexibility. The mask has so many lines and intersection points that almost any well-proportioned face will "match" several of them. And the lines are typically adjusted after the face is chosen, not before.
When researchers have actually measured faces against the phi ratio in controlled studies, the correlation between phi conformity and attractiveness ratings is weak. Faces that score well on attractiveness simply don't cluster around 1.618 ratios any more than they cluster around other numbers.
The real proportional relationships that matter — like the 36/46% ratios from Pallett et al. — are different numbers entirely. They're less elegant than phi, but they're what the data supports.
Population averages as beauty targets
If the ideal proportions are close to population averages, that has a crucial implication: the ideal proportions vary by population. East Asian faces have different average vertical and horizontal ratios than White / European faces, which differ from Black / African faces.
Le et al. (2002) documented that Vietnamese-American women have shorter lower facial thirds and wider interocular distances compared to North American Caucasian women. Park et al. (2020) found similar variation in Korean populations. Farkas et al. (2005) conducted one of the largest international anthropometric studies, confirming that facial norms differ significantly across 25 countries.
This is why any meaningful facial proportion analysis must be calibrated for the population being measured. A single universal "ideal" doesn't exist — and the golden ratio certainly isn't it.
How Desvela uses proportional analysis
Desvela's Zone 2 (Proportions) measures several ratios derived from Pallett et al.'s findings and the broader anthropometric literature. These include the vertical golden ratio (eye-to-mouth distance as a fraction of face length), horizontal golden ratio (interocular distance as a fraction of face width), the rule of facial thirds, and overall face aspect ratio.
Each ratio is scored against ethnicity-calibrated baselines, not against a single universal ideal. When you select your reference population in Desvela, the baseline means and standard deviations adjust to reflect the actual average proportions of that group.
The scoring uses a Gaussian decay function: small deviations from the baseline are barely penalized, while large deviations are progressively more costly. This matches how human perception works — a face that's slightly off-average looks fine, but a face that's far from average in multiple proportions looks "off" even if you can't immediately identify why.
What your proportion scores mean
A high Zone 2 score means your facial proportions are close to the average for your reference population — and that's a good thing. Average proportions don't mean average-looking; they mean your features are spaced in the way that human visual processing finds most balanced and harmonious.
A low Zone 2 score points to specific ratios that deviate from the norm. This is where the diagnostic overlay becomes useful: you can tap any metric to see the measurement drawn on your photo and understand exactly which proportion is driving the score. Proportional deviations often have specific cosmetic and styling solutions — hairstyle, eyebrow shape, and contouring can all shift perceived proportions.
Key takeaways
The golden ratio of 1.618 is not the secret to facial beauty. The actual "ideal" proportions are 36% vertical and 46% horizontal — close to population averages, not phi. These proportions vary by ethnicity, which means meaningful analysis requires population-calibrated baselines. The phi mask is a marketing tool, not a scientific one. Understanding your real proportions relative to your population gives you genuinely useful information.